Market Outlook
September 15, 2017
Market Cues
Domestic Indices
Chg (%)
(Pts)
(Close)
Indian markets are likely to open negative tracking global indices and SGX Nifty.
Further the news of North Korea launching its second ballistic missile over Japan will
BSE Sensex
0.2
56
32,242
keep the market participants nervous.
Nifty
0.1
7
10,087
US markets had a mixed session on Thursday, while the Dow Jones gained the tech
Mid Cap
0.6
90
16,017
heavy Nasdaq lost ground. The Dow closed at a record high of 22,203, while the
Small Cap
0.6
106
16,625
NASDAQ and S&P remained in negative territory for most of the day.
Bankex
0.5
126
28,076
The European markets remained flat initially but ended on weak note a series of
Chinese data came below expectations. Further investors remained cautious ahead
Global Indices
Chg (%)
(Pts)
(Close)
of BoEs meeting for directions.
Dow Jones
0.2
45
22,203
Indian markets traded in a narrow range for the day and finally closed on a flat
Nasdaq
(0.5)
(31)
6,429
note. The Wholesale price inflation for the month of August went up to a four month
high of 3.24%, which might impact the RBI’s decision to go for a rate cut in the near
FTSE
(1.1)
84
7,295
term. After moving higher in the last few days the Indian markets could remain
Nikkei
(0.3)
(58)
19,807
range bound in the near term.
Hang Seng
(0.4)
(117)
27,777
News Analysis
Shanghai Com
(0.4)
(13)
3,371
Maruti Suzuki to benefit as Suzuki Motor Corp to start production of Lithium Ion
Batteries in India
Advances / Declines
BSE
NSE
Detailed analysis is on Pg2
Advances
1,314
856
Declines
1,328
815
Investor’s Ready Reckoner
Unchanged
146
90
Key Domestic & Global Indicators
Stock Watch: Latest investment recommendations on 150+ stocks
Volumes (` Cr)
Refer Pg7 onwards
BSE
3,427
Top Picks
NSE
27,691
CMP
Target
Upside
Company
Sector
Rating
(`)
(`)
(%)
Blue Star
Capital Goods
Accumulate
779
807
3.5
#Net Inflows (` Cr)
Net
Mtd
Ytd
Dewan Housing FinanceFinancials
Accumulate
561
610
8.7
FII
2,586
(2,598)
44,691
Mahindra Lifespace
Real Estate
Buy
461
522
13.3
MFs
365
2,255
71,142
Navkar Corporation
Others
Buy
192
265
38.0
KEI Industries
Capital Goods
Buy
306
371
21.4
More Top Picks on Pg5
Top Gainers
Price (`)
Chg (%)
Bajajelec
405
8.7
Key Upcoming Events
Thermax
965
7.3
Previous
Consensus
Date
Region
Event Description
Reading
Expectations
Naukri
1,104
7.2
Sep 15, 2017 US
Industrial Production
0.19
0.10
Hcc
39
6.2
Sep 15, 2017 India
Imports YoY%
15.40
Pel
2,910
5.6
Sep 15, 2017 India
Exports YoY%
3.94
Sep 18, 2017 Euro Zone Euro-Zone CPI (YoY)
1.50
Sep 19, 2017 US
Housing Starts
1,155.00
1,180.00
Top Losers
Price (`)
Chg (%)
More Events on Pg7
Wipro
284
(4.1)
Eclerx
1,186
(3.6)
Centralbk
96
(3.3)
Iob
24
(3.3)
Pfizer
1,789
(3.2)
#as on 14th Sep, 2017
Market Outlook
September 15, 2017
News Analysis
Maruti Suzuki to benefit as Suzuki Motor Corp plans to start
producing Lithium Ion Batteries.
The Govt’s push towards electric vehicle seems materializing as Maruti Suzuki’s
Japanese parent company Suzuki Motor Corporation planning to make electric
cars in India at its Gujarat facility. The parent company will put in fresh ` 3900 cr
in the state for a new plant at Hansalpur to produce another 2.5 lakhs cars. It will
increase investment in the state to `13,400 cr as it intends to boost annual
manufacturing capacity in Gujarat to 7.5 lakh units within the next couple of years.
Suzuki will set up a lithium ion battery facility factory which will be used for the
electric and hybrid cars. For the new facility the company will tie up with Deno
another Japanese company. The move to get into Hybrid and electric cars will give
another set of growth drivers for the company which already is a leader in the
passenger vehicle segment in India.
Economic and Political News
Most cases on RBI’s second defaulter list may go to NCLT
WIP inflation for the month of August rose to 3.24%
Talk of Indian IT industry’s death overstated, says Rishad premji
Corporate News
Idea tells TRAI to fix IUC by separating VoLTE, other networks
Bullet train project may revive BHEL’s fortune
Indigo plans to offer business class seats on long haul flights
Market Outlook
September 15, 2017
Top Picks
Market Cap
CMP
Target
Upside
Company
Rationale
(` Cr)
(`)
(`)
(%)
Strong growth in domestic business due to its leadership
in acute therapeutic segment. Alkem expects to launch
Alkem Laboratories
21,462
1,795
2,161
20.4
more products in USA, which bodes for its international
business.
We expect the company would report strong profitability
Asian Granito
1,372
456
493
8.1
owing to better product mix, higher B2C sales and
amalgamation synergy.
Favorable outlook for the AC industry to augur well for
Cooling products business which is out pacing the
Blue Star
7,464
779
807
3.5
market growth. EMPPAC division's profitability to improve
once operating environment turns around.
With a focus on the low and medium income (LMI)
consumer segment, the company has increased its
Dewan Housing Finance
17,590
561
610
8.7
presence in tier-II & III cities where the growth
opportunity is immense.
Loan growth is likely to pick up after a sluggish FY17.
Karur Vysya Bank
9,222
153
180
18.0
Lower credit cost will help in strong bottom-line growth.
Increasing share of CASA will help in NIM improvement.
High order book execution in EPC segment, rising B2C
KEI Industries
2,377
306
371
21.4
sales and higher exports to boost the revenues and
profitability
Speedier execution and speedier sales, strong revenue
Mahindra Lifespace
2,364
461
522
13.3
visibility in short-to-long run, attractive valuations
Expected to benefit from the lower capex requirement
Music Broadcast
2,260
396
434
9.6
and 15 year long radio broadcast licensing.
Massive capacity expansion along with rail advantage at
Navkar Corporation
2,738
192
265
38.0
ICD as well CFS augurs well for the company
Strong brands and distribution network would boost
Siyaram Silk Mills
2,198
2,345
2,500
6.6
growth going ahead. Stock currently trades at an
inexpensive valuation.
Market leadership in Hindi news genre and no.
2
viewership ranking in English news genre, exit from the
TV Today Network
1,679
281
344
22.2
radio business, and anticipated growth in ad spends by
corporates to benefit the stock.
After GST, the company is expected to see higher
volumes along with improving product mix. The Gujarat
Maruti Suzuki
2,43,816
8,071
8,658
7.3
plant will also enable higher operating leverage which
will be margin accretive.
We expect loan book to grow at 24.3% over next two
GIC Housing
2,932
544
655
20.3
year; change in borrowing mix will help in NIM
improvement..
Source: Company, Angel Research
Market Outlook
September 15, 2017
Key Upcoming Events
Global economic events release calendar
Bl oomberg Data
D ate
Time
C ountry
Event Description
Unit
Period
L ast Reporte d
E stimate d
Sep 15, 2017
6:45 PM US
Industrial Production
%
Aug
0.19
0.10
India
Imports YoY%
% Change
Aug
15.40
India
Exports YoY%
% Change
Aug
3.94
Sep 18, 2017
2:30 PM Euro Zone
Euro-Zone CPI (YoY)
%
Aug F
1.50
Sep 19, 2017
6:00 PM US
Housi ng Starts
Thousands
Aug
1,155.00
1,180.00
6:00 PM US
Building permits
Thousands
Aug
1,230.00
1,210.00
Sep 20, 2017
7:30 PM US
Existing home sales
Million
Aug
5.44
5.48
11: 30 PM US
FOMC rate decision
%
Sep 20
1.25
1.25
Sep 21, 2017
7:30 PM Euro Zone
Euro-Zone Consumer Confidence
Value
Sep A
(1.50)
Sep 22, 2017
1:00 PM Germany
PMI Services
Value
Sep P
53.50
1:00 PM Germany
PMI Manufacturing
Value
Sep P
59.30
Sep 26, 2017
7:30 PM US
Consumer Confidence
S.A./ 1985=100
Sep
122.90
6:00 PM US
GDP Qoq (Annualise d)
% Change
2Q T
3.00
Sep 28, 2017
7:30 PM US
New home sales
Thousands
Aug
571.00
Sep 29, 2017
1:25 PM Germany
Unempl oyment change (000's)
Thousands
Sep
(5.00)
2:00 PM UK
GDP (YoY)
% Change
2Q F
1.70
Sep 30, 2017
6:30 AM China
PMI Manufacturing
Value
Sep
51.70
Oct 02, 2017
2:00 PM UK
PMI Manufacturing
Value
Sep
56.90
Oct 04, 2017
2:30 PM India
RBI Reverse Re po rate
%
Oct 4
5.75
2:30 PM India
RBI Repo rate
%
Oct 4
6.00
2:30 PM India
RBI Cash Reserve ratio
%
Oct 4
4.00
Oct 06, 2017
6:00 PM US
Change in N onfarm payrolls
Thousands
Sep
156.00
2:00 PM UK
Industrial Production (YoY)
% Change
Aug
0.40
Oct 10, 2017
US
Producer Price Index (mom)
% Change
Sep
0.50
Source: Bloomberg, Angel Research
Market Outlook
September 15, 2017
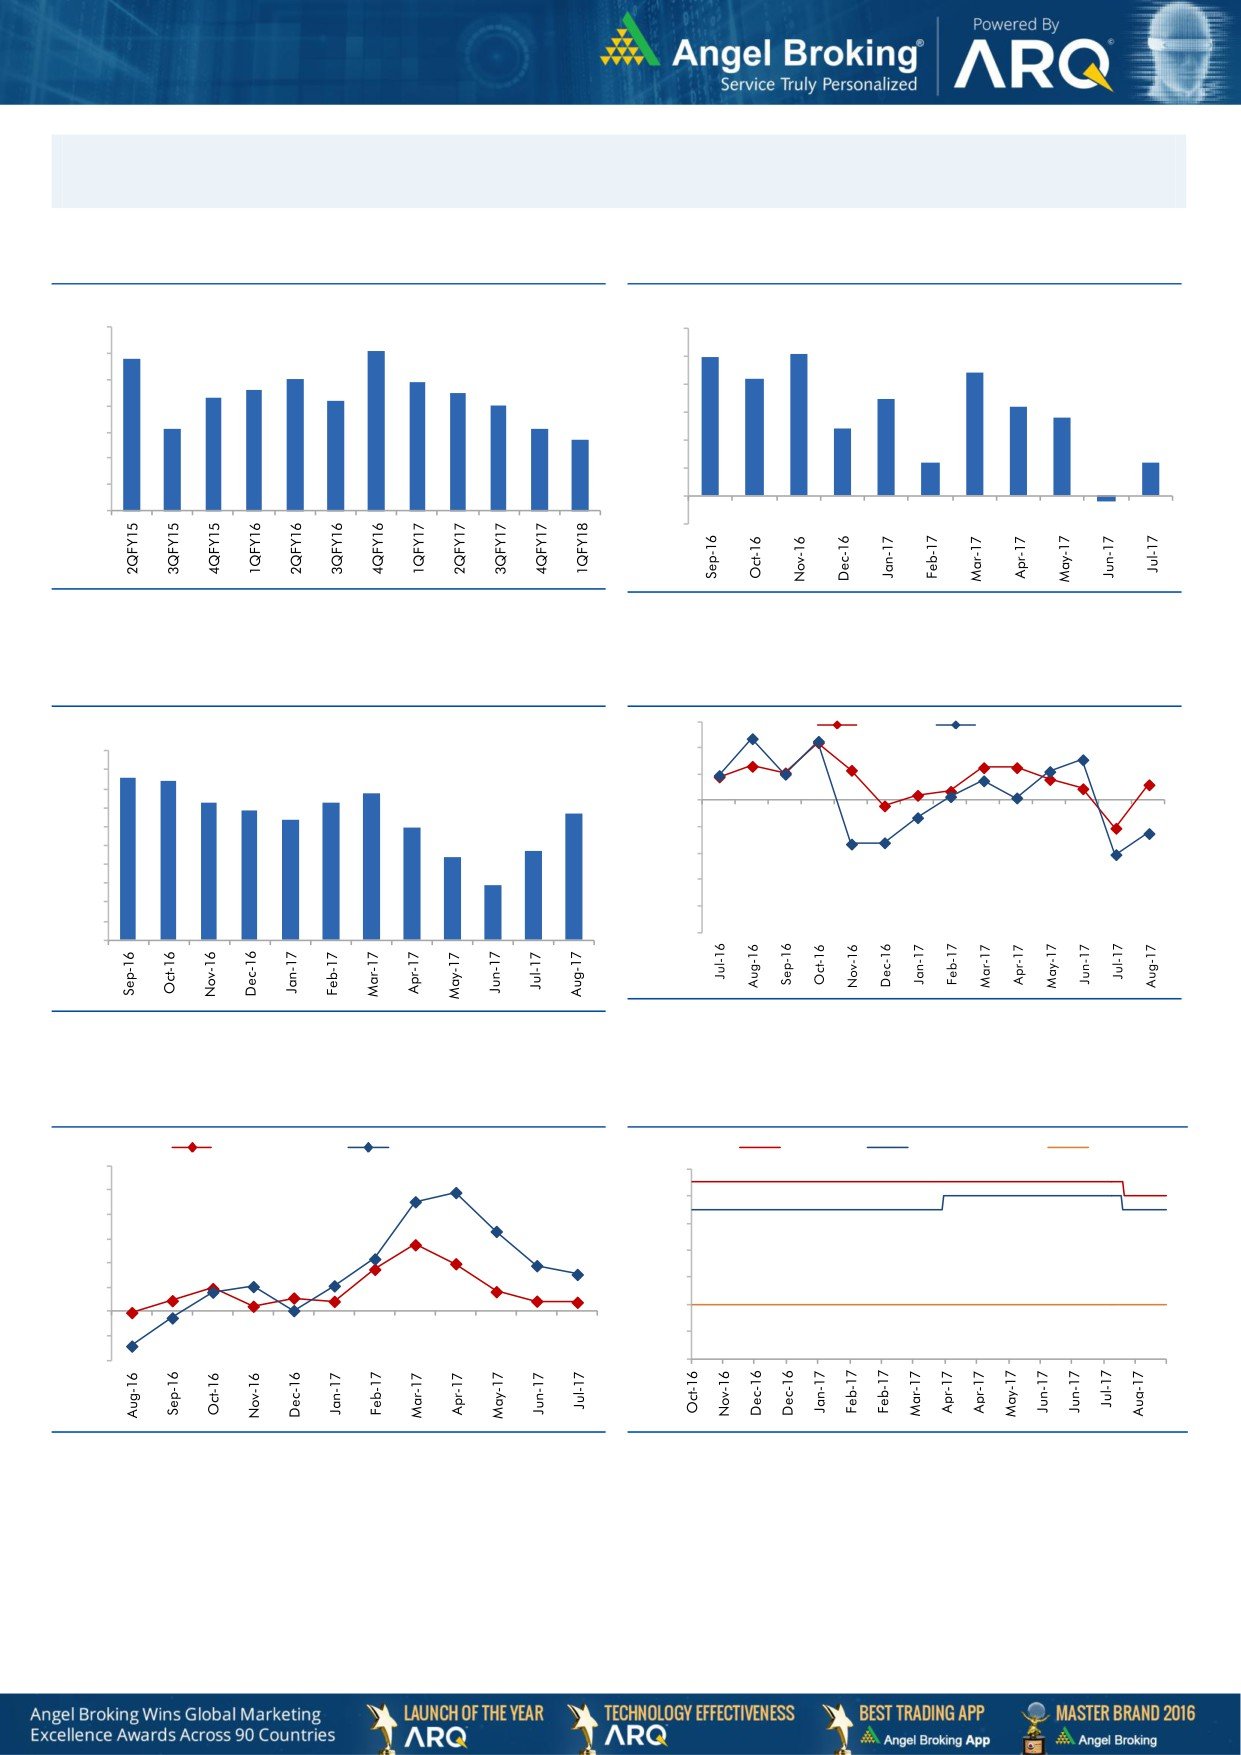
Macro watch
Exhibit 1: Quarterly GDP trends
Exhibit 2: IIP trends
(%)
(%)
10.0
6.0
9.1
5.1
8.8
5.0
9.0
5.0
4.4
8.0
7.9
4.2
7.6
7.5
8.0
7.3
7.2
4.0
3.5
7.0
3.2
2.8
7.0
6.1
6.1
3.0
2.4
5.7
6.0
2.0
1.2
1.2
5.0
1.0
4.0
-
3.0
(1.0)
(0.2)
Source: CSO, Angel Research
Source: MOSPI, Angel Research
Exhibit 3: Monthly CPI inflation trends
Exhibit 4: Manufacturing and services PMI
56.0
Mfg. PMI
Services PMI
(%)
5.0
54.0
4.3
4.2
4.5
3.9
52.0
4.0
3.6
3.7
3.4
3.4
3.2
50.0
3.5
3.0
3.0
48.0
2.4
2.2
2.5
46.0
2.0
1.5
1.5
44.0
1.0
42.0
0.5
40.0
-
Source: Market, Angel Research; Note: Level above 50 indicates expansion
Source: MOSPI, Angel Research
Exhibit 5: Exports and imports growth trends
Exhibit 6: Key policy rates
(%)
Exports yoy growth
Imports yoy growth
(%)
Repo rate
Reverse Repo rate
CRR
60.0
6.50
50.0
6.00
40.0
5.50
30.0
5.00
20.0
4.50
10.0
4.00
0.0
(10.0)
3.50
(20.0)
3.00
Source: Bloomberg, Angel Research
Source: RBI, Angel Research
Market Outlook
September 15, 2017
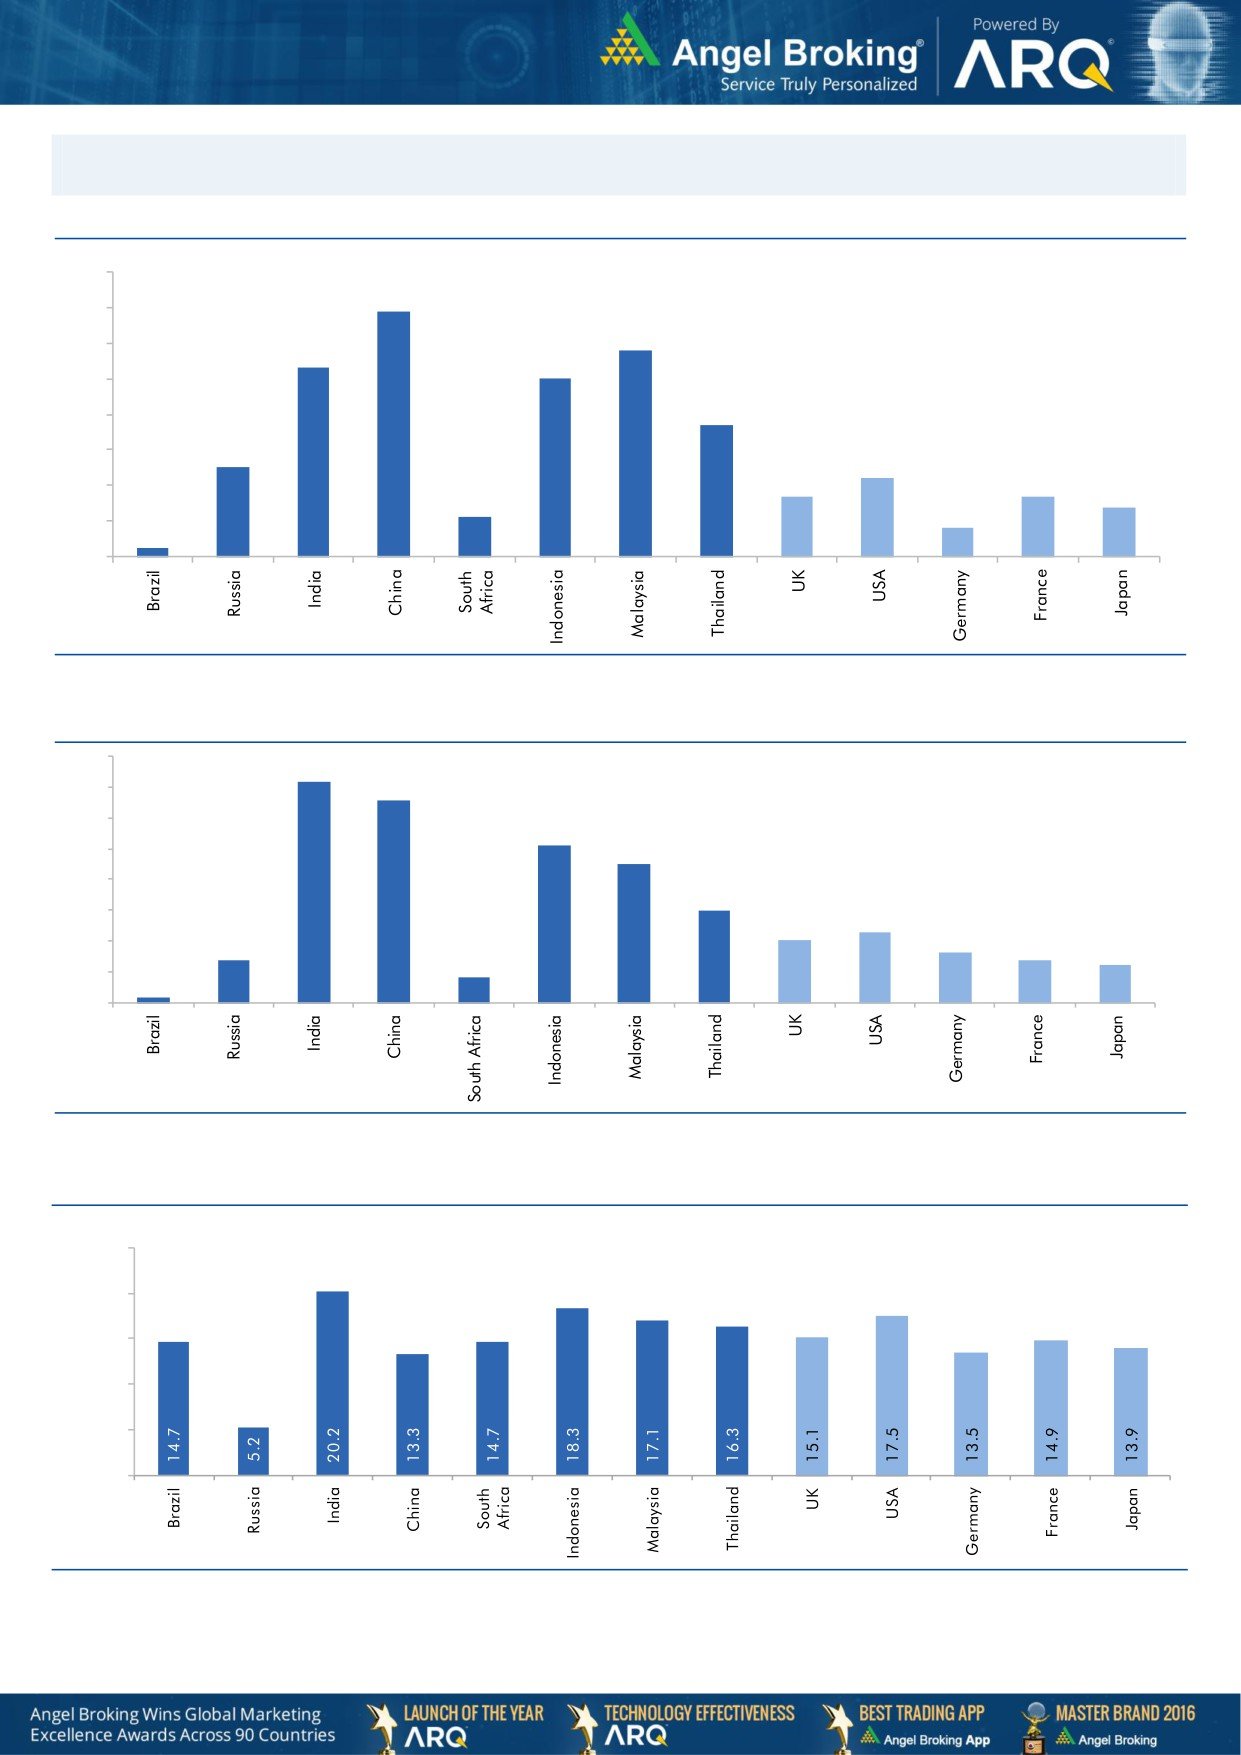
Global watch
Exhibit 1: Latest quarterly GDP Growth (%, yoy) across select developing and developed countries
(%)
8.0
6.9
7.0
5.8
6.0
5.3
5.0
5.0
1.1
3.7
4.0
2.5
3.0
2.2
1.7
1.7
2.0
1.4
0.8
1.0
0.3
-
Source: Bloomberg, Angel Research
Exhibit 2: 2017 GDP Growth projection by IMF (%, yoy) across select developing and developed countries
(%)
7.2
6.6
7.0
6.0
5.1
5.0
4.5
4.0
3.0
3.0
2.3
2.0
1.4
1.6
2.0
1.4
1.2
0.2
0.8
1.0
-
Source: IMF, Angel Research
Exhibit 3: One year forward P-E ratio across select developing and developed countries
(x)
25.0
20.0
15.0
10.0
5.0
-
Source: IMF, Angel Research
Market Outlook
September 15, 2017
Exhibit 4: Relative performance of indices across globe
Returns (%)
C ountry
Name of index
Closing price
1M
3M
1YR
Brazil
Bovespa
74,788
11.0
21.0
28.9
Russia
Micex
2,054
4.6
11.9
2.9
India
Nifty
10,079
3.9
5.0
13.8
China
Shanghai Composite
3,384
3.7
7.9
9.9
South Africa
Top 40
49,784
1.5
9.6
6.8
Mexico
Mexbol
50,165
(2.0)
2.1
9.6
Indonesia
LQ45
973
1.9
1.9
5.5
Malaysia
KLCI
1,786
0.5
0.0
6.8
Thailand
SET 50
1,049
6.3
7.2
14.5
USA
Dow Jones
22,158
1.4
3.9
22.9
UK
FTSE
7,380
1.0
(1.3)
9.6
Japan
Nikkei
19,866
1.7
(0.2)
16.3
Germany
DAX
12,554
2.9
(1.8)
20.5
France
CAC
5,218
1.5
(0.9)
15.7
Source: Bloomberg, Angel Research
Stock Watch
September 15, 2017
Company Name
Reco
CMP
Target
Mkt Cap
Sales ( Čcr )
OPM(%)
EPS (Č)
PER(x)
P/BV(x)
RoE(%)
EV/Sales(x)
(Č)
Price ( Č)
( Č cr )
FY18E FY19E
FY18E
FY19E
FY18E
FY19E
FY18E
FY19E
FY18E
FY19E
FY18E
FY19E
FY18E
FY19E
Agri / Agri Chemical
Rallis
Reduce
224
209
4,354
1,873
2,099
15.0
15.0
9.5
10.5
23.6
21.3
3.6
3.2
15.8
16.0
2.2
2.0
United Phosphorus
Neutral
820
-
41,667
18,922
21,949
18.0
18.5
36.2
45.6
22.7
18.0
4.7
3.9
22.7
23.8
2.4
2.0
Auto & Auto Ancillary
Ashok Leyland
Accumulate
117
127
34,358
23,339
27,240
10.1
10.8
4.7
6.2
25.3
18.9
5.0
4.5
20.0
23.6
1.4
1.2
Bajaj Auto
Accumulate
2,929
3,151
84,745
23,936
27,955
19.5
20.1
142.7
167.3
20.5
17.5
4.5
4.0
21.8
22.8
3.1
2.6
Bharat Forge
Neutral
1,259
-
29,313
7,637
8,755
21.7
23.2
36.1
47.3
34.9
26.7
6.3
5.3
18.5
20.8
3.7
3.1
Eicher Motors
Neutral
32,059
-
87,274
19,043
22,837
19.5
19.9
835.4
1,019.0
38.4
31.5
14.3
11.0
40.9
37.8
4.5
3.7
Gabriel India
Neutral
214
-
3,075
1,782
2,033
9.7
10.2
7.1
8.9
30.2
24.2
6.1
5.2
21.0
22.2
1.7
1.4
Hero Motocorp
Accumulate
3,895
4,129
77,776
32,239
36,878
16.0
15.6
184.4
206.5
21.1
18.9
6.6
5.8
31.3
30.7
2.2
1.9
Jamna Auto Industries Neutral
256
-
2,040
1,441
1,662
14.4
14.8
13.9
17.6
18.4
14.5
5.0
4.1
30.0
31.0
1.4
1.2
Mahindra and Mahindra Neutral
1,291
-
80,155
46,971
53,816
13.6
14.0
67.7
79.8
19.1
16.2
2.7
2.4
15.0
15.9
1.6
1.3
Maruti
Accumulate
8,071
8,658
243,816
81,825
101,245
15.0
15.0
283.5
356.0
28.5
22.7
6.2
5.1
21.9
22.4
2.6
2.1
Minda Industries
Neutral
868
-
7,499
4,328
5,084
11.0
11.9
27.3
36.4
31.8
23.8
6.7
5.3
23.1
25.6
1.8
1.5
Motherson Sumi
Neutral
330
-
69,513
55,937
64,445
10.8
11.4
16.9
21.1
19.5
15.7
4.4
4.5
25.2
25.4
1.3
1.1
Tata Motors
Neutral
404
-
116,620
303,167
343,649
11.8
13.8
33.1
54.7
12.2
7.4
2.0
1.6
16.9
23.0
0.4
0.4
TVS Motor
Neutral
641
-
30,455
13,992
16,216
9.0
9.4
17.1
20.3
37.6
31.6
10.0
7.7
29.7
27.7
2.1
1.8
Amara Raja Batteries
Accumulate
785
858
13,400
6,140
7,122
14.3
15.6
29.3
39.0
26.8
20.1
4.6
3.8
17.1
19.0
2.2
1.9
Exide Industries
Neutral
220
-
18,726
8,689
9,854
15.1
15.2
9.7
11.0
22.8
20.0
4.1
3.6
15.7
16.1
1.9
1.6
Apollo Tyres
Neutral
260
-
13,214
15,739
17,326
13.3
14.6
20.4
26.7
12.7
9.7
1.5
1.4
20.4
26.7
1.1
1.0
Ceat
Neutral
1,764
-
7,134
6,661
7,717
11.1
14.2
116.2
178.2
15.2
9.9
2.6
2.2
15.2
21.3
1.2
1.0
JK Tyres
Neutral
150
-
3,392
8,318
9,239
16.2
16.4
21.0
27.5
7.1
5.4
1.4
1.1
19.1
20.4
0.9
0.7
Swaraj Engines
Neutral
2,057
-
2,555
788
889
16.4
16.5
71.6
81.0
28.7
25.4
8.3
7.7
29.6
31.0
2.9
2.5
Subros
Neutral
238
-
1,427
1,855
2,135
11.6
11.8
10.3
14.7
23.2
16.2
3.5
3.0
15.8
19.1
1.0
0.8
Capital Goods
BEML
Neutral
1,869
-
7,783
4,286
5,194
7.1
8.2
42.9
58.1
43.6
32.2
3.6
3.2
7.6
8.7
1.9
1.5
Bharat Electronics
Neutral
190
-
42,484
10,258
12,470
19.6
19.5
7.3
8.6
26.1
22.1
0.5
0.5
20.4
21.9
3.6
3.0
Voltas
Neutral
544
-
17,998
6,778
8,004
9.6
11.0
17.1
22.4
31.8
24.3
7.6
6.7
17.7
19.8
2.3
2.0
BHEL
Neutral
137
-
33,630
33,200
39,167
6.8
9.5
6.2
11.2
22.2
12.3
1.0
1.0
4.6
8.0
0.6
0.4
Blue Star
Accumulate
779
850
7,464
5,101
5,997
6.0
7.0
17.9
26.6
43.5
29.3
9.3
8.5
21.9
29.0
1.5
1.3
CG Power and Industrial
Neutral
85
-
5,343
6,555
7,292
7.5
7.5
-
0.8
8,525.0
106.6
1.3
1.3
0.1
1.2
0.9
0.8
Solutions
Greaves Cotton
Neutral
143
-
3,501
1,778
1,993
14.7
15.1
8.1
9.1
17.7
15.8
4.0
3.7
21.8
23.6
1.7
1.5
Stock Watch
September 15, 2017
Company Name
Reco
CMP
Target
Mkt Cap
Sales ( Čcr )
OPM(%)
EPS (Č)
PER(x)
P/BV(x)
RoE(%)
EV/Sales(x)
(Č)
Price ( Č)
( Č cr )
FY18E FY19E
FY18E
FY19E
FY18E
FY19E
FY18E
FY19E
FY18E
FY19E
FY18E
FY19E
FY18E
FY19E
Capital Goods
KEC International
Accumulate
330
350
8,483
9,779
11,113
9.4
9.8
14.2
18.2
23.2
18.1
4.5
3.7
21.1
22.1
1.1
1.0
KEI Industries
Buy
306
371
2,377
3,001
3,391
10.0
10.0
13.0
16.1
23.5
19.0
4.3
3.5
18.2
18.7
1.0
0.9
Thermax
Neutral
965
-
11,493
4,125
4,747
10.3
10.8
26.7
31.5
36.1
30.6
4.1
3.7
11.2
12.0
2.5
2.2
VATech Wabag
Accumulate
630
681
3,440
3,867
4,126
9.6
10.0
34.9
39.8
18.1
15.8
3.0
2.6
17.7
17.5
0.9
0.8
Cement
ACC
Neutral
1,844
-
34,627
12,255
13,350
13.5
14.3
58.0
66.2
31.8
27.9
3.8
3.5
11.5
12.2
2.8
2.6
Ambuja Cements
Neutral
284
-
56,462
10,250
11,450
17.5
19.0
7.2
8.3
39.5
34.3
2.8
2.7
7.0
7.8
5.3
4.7
India Cements
Neutral
196
-
6,049
6,135
6,750
14.8
15.2
8.5
11.5
23.1
17.1
1.1
1.1
4.8
6.2
1.3
1.2
JK Cement
Neutral
1,036
-
7,241
4,150
4,775
19.2
20.0
49.0
63.5
21.1
16.3
3.3
2.9
17.0
18.5
2.2
1.9
J K Lakshmi Cement
Neutral
425
-
5,006
3,422
3,757
15.5
17.0
13.5
23.2
31.5
18.3
3.3
2.8
10.8
15.5
1.9
1.6
Orient Cement
Neutral
161
-
3,296
2,215
3,233
16.8
17.0
5.9
6.9
27.3
23.3
2.1
1.9
10.8
10.1
2.5
1.7
UltraTech Cement
Neutral
4,202
-
115,366
28,250
35,150
20.2
23.5
77.5
122.2
54.2
34.4
4.6
4.1
9.6
14.8
4.6
3.6
Construction
KNR Constructions
Neutral
202
-
2,847
1,846
2,203
14.5
14.5
12.1
13.7
16.7
14.8
0.9
0.8
17.5
16.7
1.6
1.3
Larsen & Toubro
Neutral
1,215
-
170,124
95,787
109,476
10.2
11.6
44.5
50.8
27.3
23.9
3.4
3.1
12.9
13.1
2.3
2.1
Gujarat Pipavav Port
Neutral
145
-
7,015
739
842
61.6
62.7
5.1
6.2
28.5
23.6
3.6
3.5
12.7
14.9
9.0
7.7
PNC Infratech
Accumulate
134
143
3,448
2,040
2,935
13.0
13.0
6.4
9.0
21.0
14.9
0.5
0.5
9.7
12.2
1.7
1.2
Simplex Infra
Neutral
465
-
2,299
6,012
6,619
11.6
11.7
21.1
31.0
22.1
15.0
1.5
1.4
6.5
8.6
0.9
0.8
Sadbhav Engineering
Neutral
293
-
5,028
3,823
4,426
10.7
10.8
10.3
11.8
28.5
24.8
3.4
3.0
10.1
10.5
1.6
1.4
NBCC
Neutral
212
-
19,121
9,099
12,706
6.4
6.4
7.3
9.6
29.2
22.2
1.3
1.0
27.5
30.5
2.0
1.4
MEP Infra
Neutral
107
-
1,747
2,403
2,910
18.3
16.8
2.4
6.1
45.7
17.7
17.3
11.7
35.2
55.8
1.9
1.6
SIPL
Neutral
98
-
3,464
2,060
2,390
46.8
47.7
(5.8)
(3.1)
3.7
4.2
(14.2)
(2.3)
6.4
6.0
Engineers India
Neutral
157
-
10,593
1,795
2,611
21.1
22.4
5.9
8.1
26.6
19.4
1.9
1.8
12.9
16.1
4.3
2.8
Financials
Axis Bank
Accumulate
520
580
124,615
32,558
35,843
3.5
3.2
27.8
41.0
18.7
12.7
2.0
1.8
11.4
14.9
-
-
Bank of Baroda
Neutral
146
-
33,595
22,533
26,079
2.4
2.4
12.0
20.9
12.1
7.0
0.8
0.8
6.6
11.0
-
-
Canara Bank
Neutral
346
-
20,669
17,925
20,235
2.0
2.1
18.5
36.5
18.7
9.5
0.7
0.7
3.4
6.2
-
-
Can Fin Homes
Neutral
2,804
-
7,463
586
741
3.5
3.5
107.8
141.0
26.0
19.9
5.7
4.6
24.1
25.6
-
-
Cholamandalam Inv. &
Neutral
1,174
-
18,349
2,826
3,307
6.3
6.3
53.7
64.6
21.9
18.2
3.7
3.2
18.3
18.9
-
-
Fin. Co.
Dewan Housing Finance Accumulate
561
610
17,581
2,676
3,383
2.4
2.7
37.4
49.7
15.0
11.3
2.0
1.7
13.8
16.2
-
-
Equitas Holdings
Buy
165
235
5,578
1,125
1,380
9.6
9.8
1.5
6.0
109.8
27.4
2.5
2.3
2.4
8.2
-
-
Federal Bank
Accumulate
115
125
22,314
4,896
5,930
2.8
3.1
5.4
7.6
21.3
15.1
1.8
1.7
8.5
11.0
-
-
Stock Watch
September 15, 2017
Company Name
Reco
CMP
Target
Mkt Cap
Sales ( Čcr )
OPM(%)
EPS (Č)
PER(x)
P/BV(x)
RoE(%)
EV/Sales(x)
(Č)
Price ( Č)
( Č cr )
FY18E FY19E
FY18E
FY19E
FY18E
FY19E
FY18E
FY19E
FY18E
FY19E
FY18E
FY19E
FY18E
FY19E
Financials
GIC Housing
Buy
544
655
2,932
376
477
3.6
3.7
33.0
40.0
16.5
13.6
3.0
2.5
20.0
23.0
-
-
HDFC Bank
Neutral
1,843
-
475,802
55,236
63,253
4.5
4.4
68.9
82.4
26.8
22.4
4.7
3.9
18.7
18.5
-
-
ICICI Bank
Accumulate
294
315
188,530
42,361
51,378
3.6
3.9
18.4
25.7
16.0
11.4
1.7
1.7
11.3
15.0
-
-
Karur Vysya Bank
Buy
153
180
9,222
3,289
3,630
3.7
3.9
10.8
14.1
14.1
10.8
1.7
1.5
12.5
14.7
-
-
LIC Housing Finance
Neutral
660
-
33,305
4,895
6,332
3.4
3.7
50.7
66.8
13.0
9.9
2.6
2.1
21.7
23.8
-
-
Punjab Natl.Bank
Neutral
145
-
30,898
23,708
25,758
2.1
2.1
5.9
16.4
24.7
8.9
0.7
0.7
3.0
8.3
-
-
RBL Bank
Neutral
532
-
21,983
2,309
2,888
2.6
2.5
16.4
19.1
32.5
27.9
4.1
3.6
13.3
13.8
-
-
Repco Home Finance
Buy
669
825
4,184
496
597
4.4
4.2
38.5
48.7
17.4
13.7
3.1
2.6
19.6
20.6
-
-
South Ind.Bank
Neutral
29
-
5,170
3,195
3,567
3.0
3.1
3.0
3.8
9.5
7.5
0.9
0.8
10.5
11.9
-
-
St Bk of India
Neutral
274
-
236,432
105,827
121,056
2.4
2.5
16.1
25.6
17.0
10.7
1.3
1.2
6.6
9.9
-
-
Union Bank
Neutral
138
-
9,992
14,650
16,225
2.3
2.3
23.1
32.5
6.0
4.2
0.5
0.4
7.1
9.2
-
-
Yes Bank
Neutral
1,852
-
84,833
11,088
13,138
3.0
2.9
84.0
99.3
22.1
18.7
3.4
2.9
16.3
16.8
-
-
FMCG
Akzo Nobel India
Neutral
1,816
-
8,710
3,164
3,607
13.8
13.7
58.6
67.9
31.0
26.7
7.6
6.7
24.5
25.1
2.6
2.3
Asian Paints
Neutral
1,245
-
119,444
17,603
20,615
18.6
18.6
2,128.9
2,543.3
0.6
0.5
12.3
10.4
28.0
28.9
6.6
5.6
Britannia
Neutral
4,342
-
52,130
9,690
11,278
14.8
15.4
84.0
101.0
51.7
43.0
18.8
15.0
40.6
39.0
5.3
4.6
Colgate
Neutral
1,141
-
31,031
4,420
5,074
24.9
25.3
28.6
32.8
39.9
34.8
15.7
12.7
43.8
40.5
6.8
5.9
Dabur India
Neutral
308
-
54,220
8,346
9,344
19.6
19.9
7.8
9.0
39.5
34.2
8.0
7.2
25.2
24.8
6.1
5.4
GlaxoSmith Con*
Neutral
5,090
-
21,406
5,072
5,760
18.2
18.4
176.3
199.2
28.9
25.6
6.1
5.5
21.2
21.7
3.5
3.1
Godrej Consumer
Neutral
937
-
63,820
10,171
11,682
20.8
21.5
21.7
27.1
43.2
34.6
9.7
8.3
22.3
23.4
6.4
5.5
HUL
Neutral
1,247
-
269,867
37,077
41,508
20.3
21.8
5,189.9
6,318.5
0.2
0.2
38.0
32.5
74.8
82.0
7.1
6.4
ITC
Neutral
272
-
331,122
44,588
49,853
37.0
37.3
9.6
11.0
28.3
24.7
7.0
6.6
25.1
27.3
6.9
6.1
Marico
Neutral
331
-
42,753
6,788
7,766
18.5
19.2
7.1
8.5
46.7
39.0
16.3
14.0
36.9
38.0
6.1
5.4
Nestle*
Neutral
7,253
-
69,926
10,083
11,182
20.0
20.9
119.7
141.3
60.6
51.3
213.5
195.2
36.7
39.8
6.6
5.9
Tata Global
Neutral
212
-
13,370
7,121
7,641
11.9
12.3
6.9
8.0
30.7
26.5
2.1
2.0
6.8
7.2
1.7
1.5
Procter & Gamble
Neutral
8,394
-
27,246
3,034
3,579
27.1
27.7
167.7
198.8
50.1
42.2
13.4
11.6
28.8
29.5
8.4
7.0
Hygiene
IT
HCL Tech^
Buy
880
1,014
125,611
52,342
57,053
20.9
20.9
62.8
67.6
14.0
13.0
3.1
2.7
22.4
20.6
2.1
1.8
Infosys
Buy
892
1,179
204,958
73,963
80,619
26.0
26.0
64.4
69.3
13.9
12.9
2.7
2.5
19.7
19.6
2.2
2.0
TCS
Accumulate
2,485
2,651
489,661
127,403
138,870
27.6
27.6
144.5
156.0
17.2
15.9
5.1
4.8
29.7
29.8
3.5
3.2
Tech Mahindra
Buy
441
533
42,998
31,015
33,496
15.0
15.0
35.6
38.1
12.4
11.6
2.1
2.0
17.0
16.3
1.2
1.0
Stock Watch
September 15, 2017
Company Name
Reco
CMP
Target
Mkt Cap
Sales ( Čcr )
OPM(%)
EPS (Č)
PER(x)
P/BV(x)
RoE(%)
EV/Sales(x)
(Č)
Price ( Č)
( Č cr )
FY18E FY19E
FY18E
FY19E
FY18E
FY19E
FY18E
FY19E
FY18E
FY19E
FY18E
FY19E
FY18E
FY19E
IT
Wipro
Neutral
284
-
138,165
58,536
61,858
20.3
20.3
18.2
19.1
15.6
14.9
2.4
2.1
14.6
13.4
2.3
2.2
Media
D B Corp
Neutral
366
-
6,740
2,404
2,625
30.5
31.5
23.7
26.9
15.5
13.6
3.6
3.1
23.5
22.8
2.6
2.4
HT Media
Neutral
97
-
2,263
2,589
2,830
15.1
15.4
8.3
10.9
11.7
8.9
1.0
0.9
8.4
10.4
0.4
0.3
Jagran Prakashan
Buy
181
225
5,902
2,541
2,835
28.5
28.7
12.7
14.1
14.2
12.8
3.0
2.6
21.3
21.4
2.2
1.9
Sun TV Network
Neutral
836
-
32,951
3,238
3,789
51.9
55.1
30.9
38.0
27.1
22.0
7.7
6.8
30.0
31.0
9.7
8.2
Hindustan Media
Neutral
261
-
1,913
1,002
1,074
23.3
23.5
29.2
33.8
8.9
7.7
1.4
1.2
15.6
15.4
0.9
0.6
Ventures
TV Today Network
Buy
281
344
1,679
667
727
27.7
27.7
18.6
20.1
15.1
14.0
2.4
2.4
15.6
17.3
2.0
1.9
Music Broadcast Limited Accumulate
396
434
2,260
271
317
91.0
109.0
6.0
10.0
66.0
39.6
4.1
3.7
6.5
9.3
7.9
6.5
Metals & Mining
Coal India
Neutral
255
-
158,258
82,301
91,235
17.0
18.0
17.1
20.5
14.9
12.4
2.8
2.6
45.0
55.0
1.6
1.4
Hind. Zinc
Neutral
304
-
128,492
22,108
24,555
57.0
58.0
22.1
26.3
13.8
11.6
4.5
3.6
32.0
35.0
4.8
4.0
Hindalco
Neutral
247
-
55,428
102,350
105,355
13.5
14.5
21.5
24.5
11.5
10.1
1.6
1.3
15.0
15.2
1.1
1.1
JSW Steel
Neutral
265
-
64,105
64,500
68,245
21.1
21.5
20.1
21.2
13.2
12.5
2.4
2.1
-
-
1.7
1.6
NMDC
Neutral
133
-
42,016
10,209
11,450
47.0
48.0
11.1
12.1
12.0
11.0
1.7
1.6
-
-
3.6
3.3
SAIL
Neutral
62
-
25,607
54,100
63,555
3.0
10.0
(10.0)
1.5
41.3
0.8
0.8
-
-
1.5
1.3
Vedanta
Neutral
320
-
118,839
81,206
87,345
28.0
29.0
26.5
33.5
12.1
9.5
2.7
2.4
-
-
2.2
1.9
Tata Steel
Neutral
678
-
65,814
121,445
126,500
16.2
17.2
65.4
81.3
10.4
8.3
1.7
1.4
-
-
1.1
0.9
Oil & Gas
GAIL
Neutral
401
-
67,771
53,115
52,344
14.2
15.3
30.0
31.1
13.4
12.9
1.7
1.5
-
-
1.0
1.0
ONGC
Neutral
159
-
204,562
83,111
84,934
44.2
44.9
16.4
16.9
9.7
9.4
1.2
1.1
-
-
2.3
2.3
Indian Oil Corp
Neutral
420
-
203,899
396,116
432,560
8.5
8.8
40.1
42.2
10.5
10.0
1.8
1.6
-
-
0.7
0.6
Reliance Industries
Neutral
844
-
549,051
257,711
267,438
17.0
18.2
89.1
89.5
9.5
9.4
0.9
0.8
-
-
1.8
1.7
Pharmaceuticals
Alembic Pharma
Buy
503
600
9,484
3,903
4,584
18.2
19.2
21.8
27.2
23.1
18.5
4.2
3.5
19.8
20.6
2.5
2.1
Alkem Laboratories Ltd
Buy
1,795
2,161
21,462
6,901
7,850
18.4
19.1
85.0
100.5
21.1
17.9
4.3
3.6
20.2
20.1
3.1
2.7
Aurobindo Pharma
Accumulate
766
823
44,893
17,086
19,478
22.1
22.0
44.7
51.4
17.1
14.9
3.8
3.1
24.7
22.7
2.7
2.4
Aventis*
Neutral
4,051
-
9,329
2,508
2,862
16.8
16.8
139.9
153.8
29.0
26.3
4.2
3.4
23.5
25.8
3.3
2.7
Cadila Healthcare
Reduce
481
426
49,222
11,584
13,228
20.3
20.4
18.7
21.3
25.7
22.6
5.7
4.7
24.6
22.9
4.1
3.5
Cipla
Sell
565
458
45,449
16,619
19,437
15.4
16.2
19.7
24.3
28.7
23.2
3.3
2.9
12.0
13.2
2.9
2.5
Dr Reddy's
Neutral
2,250
-
37,303
15,844
17,973
17.6
18.2
91.7
111.0
24.5
20.3
2.8
2.5
11.9
13.0
2.6
2.3
GSK Pharma*
Neutral
2,381
-
20,168
3,260
3,651
15.0
18.0
46.1
58.6
51.7
40.6
10.6
10.9
20.0
26.5
6.1
5.5
Indoco Remedies
Sell
197
153
1,813
1,154
1,310
14.9
14.9
11.3
12.7
17.4
15.5
2.5
2.2
15.0
15.0
1.7
1.4
Stock Watch
September 15, 2017
Company Name
Reco
CMP
Target
Mkt Cap
Sales ( Čcr )
OPM(%)
EPS (Č)
PER(x)
P/BV(x)
RoE(%)
EV/Sales(x)
(Č)
Price ( Č)
( Č cr )
FY18E FY19E
FY18E
FY19E
FY18E
FY19E
FY18E
FY19E
FY18E
FY19E
FY18E
FY19E
FY18E
FY19E
Pharmaceuticals
Ipca labs
Accumulate
476
540
6,010
3,593
4,022
14.5
15.5
19.4
25.2
24.6
18.9
2.2
2.0
9.5
11.2
1.7
1.5
Lupin
Buy
1,004
1,467
45,340
18,657
21,289
21.3
23.3
52.8
66.7
19.0
15.1
2.9
2.4
16.3
17.5
2.4
2.0
Natco Pharma
Neutral
794
-
13,836
1,836
1,946
31.8
28.9
22.1
20.6
35.9
38.5
7.2
6.4
20.1
16.7
7.4
6.9
Sun Pharma
Accumulate
524
558
125,781
32,899
36,451
26.9
25.4
31.6
32.3
16.6
16.2
2.9
2.5
18.7
18.8
3.4
3.0
Syngene International
Buy
476
557
9,523
1,402
1,823
32.8
36.0
15.9
20.7
30.0
23.1
5.6
4.6
18.7
20.0
6.8
5.2
Power
Tata Power
Neutral
85
-
23,058
32,547
33,806
20.5
20.5
4.7
5.4
18.1
15.9
1.7
1.5
10.5
10.5
1.7
1.6
NTPC
Neutral
169
-
139,019
86,070
101,246
28.3
30.7
12.9
16.2
13.1
10.4
1.4
1.2
10.6
12.4
3.0
2.7
Power Grid
Neutral
213
-
111,590
29,183
32,946
89.7
90.0
18.0
20.8
11.9
10.3
2.0
1.8
17.7
18.2
7.8
7.2
Real Estate
Prestige Estate
Neutral
257
-
9,623
4,607
5,146
21.0
22.2
7.9
9.8
32.5
26.2
2.0
1.9
10.3
12.0
3.3
3.0
MLIFE
Accumulate
461
522
2,364
487
590
12.3
17.8
21.0
31.2
21.9
14.8
1.2
1.1
5.2
7.4
3.6
2.9
Telecom
Bharti Airtel
Neutral
398
-
159,176
97,903
105,233
36.0
36.3
9.3
11.1
42.8
36.0
2.1
2.0
5.0
5.6
2.6
2.3
Idea Cellular
Neutral
82
-
29,486
35,012
37,689
27.1
27.7
(4.4)
(2.7)
1.3
1.3
(6.8)
(4.6)
2.2
1.9
zOthers
Abbott India
Neutral
4,110
-
8,733
3,244
3,723
14.9
16.1
167.5
209.4
24.5
19.6
5.4
4.5
23.7
24.8
2.3
2.0
Asian Granito
Accumulate
457
493
1,374
1,169
1,286
12.5
12.5
16.0
19.7
28.6
23.2
3.1
2.7
10.7
11.6
1.4
1.2
Bajaj Electricals
Neutral
401
-
4,072
4,646
5,301
6.7
7.6
16.1
22.3
24.9
18.0
4.1
3.5
16.4
19.2
0.9
0.8
Banco Products (India)
Neutral
218
-
1,561
1,530
1,695
13.2
12.7
19.0
20.0
11.5
10.9
1.8
1.6
0.2
0.2
0.9
103.3
Coffee Day Enterprises
Neutral
244
-
5,023
3,494
3,913
17.4
18.0
4.8
5.7
-
42.8
2.2
2.1
-
0.1
1.9
1.7
Ltd
Elecon Engineering
Neutral
54
-
609
171
201
15.0
16.2
36.0
43.0
1.5
1.3
0.1
0.1
0.1
0.1
2.9
2.5
Garware Wall Ropes
Neutral
882
-
1,930
928
1,003
15.2
15.2
39.4
43.2
22.4
20.4
3.7
3.2
16.5
15.4
1.9
1.7
Goodyear India*
Neutral
833
-
1,922
1,717
1,866
11.8
12.3
47.9
49.8
17.4
16.7
2.7
2.3
15.6
15.7
0.8
116.7
Hitachi
Neutral
1,952
-
5,307
2,355
2,715
10.3
10.8
49.0
60.9
39.8
32.1
9.3
7.4
0.2
0.2
2.3
2.0
HSIL
Neutral
389
-
2,809
2,240
2,670
14.6
15.0
17.0
22.0
22.9
17.7
1.9
1.8
0.1
0.1
1.5
1.2
Interglobe Aviation
Neutral
1,184
-
42,814
22,570
27,955
14.2
15.0
63.6
81.8
18.6
14.5
9.8
8.3
0.5
0.6
1.6
1.2
Jyothy Laboratories
Neutral
412
-
7,486
1,781
2,044
14.1
15.0
9.4
10.5
44.1
39.2
9.4
8.8
0.2
0.2
4.4
3.8
Linc Pen & Plastics
Neutral
237
-
350
420
462
9.3
9.3
15.3
17.1
15.5
13.8
2.6
2.7
16.9
19.5
0.9
0.8
M M Forgings
Neutral
615
-
743
542
642
20.1
21.0
41.6
56.8
14.8
10.8
2.0
1.7
0.1
0.2
1.8
1.6
Mirza International
Neutral
174
-
2,098
1,148
1,285
18.0
18.0
8.0
9.4
21.7
18.7
3.6
3.0
16.3
16.1
2.0
1.7
Navkar Corporation
Buy
192
265
2,738
561
617
41.5
41.5
11.5
12.7
16.7
15.1
1.8
1.6
10.5
10.4
5.6
4.8
Nilkamal
Neutral
1,586
-
2,367
2,317
2,525
11.4
11.1
96.0
105.0
16.5
15.1
2.8
2.4
0.2
0.2
1.0
0.9
Stock Watch
September 15, 2017
Company Name
Reco
CMP
Target Mkt Cap
Sales ( Čcr )
OPM(%)
EPS (Č)
PER(x)
P/BV(x)
RoE(%)
EV/Sales(x)
(Č)
Price ( Č)
( Č cr )
FY18E FY19E FY18E FY19E FY18E FY19E FY18E FY19E FY18E FY19E FY18E FY19E FY18E FY19E
zOthers
Parag Milk Foods
Neutral
250
-
2,100
1,987
2,379
7.6
9.0
12.4
18.3
20.1
13.6
2.8
2.5
8.2
13.2
1.2
1.0
Radico Khaitan
Neutral
175
-
2,325
1,811
1,992
13.2
13.2
8.1
8.8
21.6
19.8
2.2
2.4
10.1
12.0
1.6
1.5
Relaxo Footwears
Neutral
519
-
6,240
1,981
2,310
13.7
14.5
12.0
15.5
43.3
33.5
8.4
6.8
0.2
0.2
3.2
2.8
Siyaram Silk Mills
Accumulate
2,345
2,500
2,198
1,769
1,981
12.7
12.7
113.1
131.1
20.7
17.9
3.2
2.8
15.5
15.5
1.4
1.3
Styrolution ABS India* Neutral
928
-
1,632
1,800
1,980
8.0
8.1
42.0
46.2
22.1
20.1
2.5
2.2
0.1
0.1
1.0
0.9
Surya Roshni
Neutral
305
-
1,337
4,870
5,320
7.7
7.8
22.8
28.1
13.4
10.9
1.8
1.5
0.1
0.1
0.5
0.4
TVS Srichakra
Neutral
3,151
-
2,413
2,729
2,893
12.7
12.5
248.5
265.0
12.7
11.9
3.6
2.9
0.3
0.3
0.9
0.8
Visaka Industries
Neutral
643
-
1,022
1,104
1,214
12.1
12.6
31.0
37.9
20.8
17.0
2.5
2.3
0.1
0.1
1.2
1.0
VIP Industries
Accumulate
230
250
3,252
1,450
1,693
10.4
10.5
6.5
7.8
35.2
29.5
7.4
6.5
21.1
22.1
2.2
1.9
Navin Fluorine
Accumulate
658
730
3,245
945
1,154
22.4
22.6
28.7
34.8
23.0
18.9
3.8
3.2
-
-
3.0
2.3
Source: Company, Angel Research; Note: *December year end; #September year end; &October year end; Price as on September 14, 2017
Market Outlook
September 15, 2017
Research Team Tel: 022 - 39357800
DISCLAIMER
Angel Broking Private Limited (hereinafter referred to as “Angel”) is a registered Member of National Stock Exchange of India
Limited,Bombay Stock Exchange Limited and Metropolitan Stock Exchange Limited. It is also registered as a Depository Participant with
CDSL and Portfolio Manager with SEBI. It also has registration with AMFI as a Mutual Fund Distributor. Angel Broking Private Limited is a
registered entity with SEBI for Research Analyst in terms of SEBI (Research Analyst) Regulations, 2014 vide registration number
INH000000164. Angel or its associates has not been debarred/ suspended by SEBI or any other regulatory authority for accessing
/dealing in securities Market. Angel or its associates/analyst has not received any compensation / managed or
co-managed public offering of securities of the company covered by Analyst during the past twelve months.
This document is solely for the personal information of the recipient, and must not be singularly used as the basis of any investment
decision. Nothing in this document should be construed as investment or financial advice. Each recipient of this document should make
such investigations as they deem necessary to arrive at an independent evaluation of an investment in the securities of the companies
referred to in this document (including the merits and risks involved), and should consult their own advisors to determine the merits and
risks of such an investment.
Reports based on technical and derivative analysis center on studying charts of a stock's price movement, outstanding positions and
trading volume, as opposed to focusing on a company's fundamentals and, as such, may not match with a report on a company's
fundamentals. Investors are advised to refer the Fundamental and Technical Research Reports available on our website to evaluate the
contrary view, if any.
The information in this document has been printed on the basis of publicly available information, internal data and other reliable
sources believed to be true, but we do not represent that it is accurate or complete and it should not be relied on as such, as this
document is for general guidance only. Angel Broking Pvt. Limited or any of its affiliates/ group companies shall not be in any way
responsible for any loss or damage that may arise to any person from any inadvertent error in the information contained in this report.
Angel Broking Pvt. Limited has not independently verified all the information contained within this document. Accordingly, we cannot
testify, nor make any representation or warranty, express or implied, to the accuracy, contents or data contained within this document.
While Angel Broking Pvt. Limited endeavors to update on a reasonable basis the information discussed in this material, there may be
regulatory, compliance, or other reasons that prevent us from doing so.
This document is being supplied to you solely for your information, and its contents, information or data may not be reproduced,
redistributed or passed on, directly or indirectly.
Neither Angel Broking Pvt. Limited, nor its directors, employees or affiliates shall be liable for any loss or damage that may arise from
or in connection with the use of this information.